

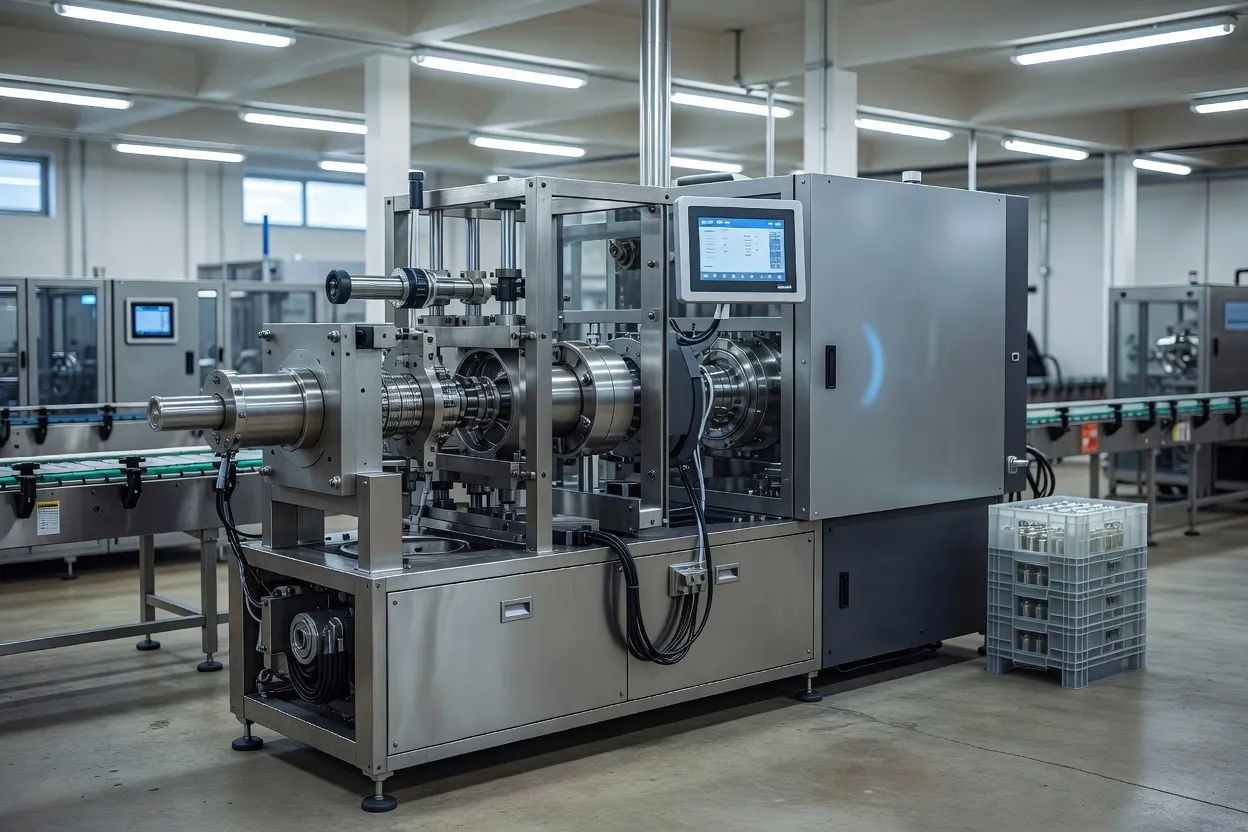
PET water-bottling equipment suppliers are positioning cavity count and control architecture as the main levers for capacity in 2026, but the available figures show that output gains remain constrained by thermal balance, bottle format, compressed-air use, and quality control. The evidence combines equipment guidance with a Mexican installation case study and Fakuma-related industry coverage; it does not establish a single market-wide performance benchmark.
Cavity count sets the theoretical ceiling
The relationship is straightforward: total bottles per hour equals the number of cavities multiplied by cycles per hour. The practical limit is less simple. A high-cavity mold requires a tighter pitch inside the machine, and that pitch restricts bottle diameter. The cited guidance places 24 cavities alongside larger 1.5-liter formats, while 32 cavities on the same chassis may be directed toward 500-milliliter bottles.
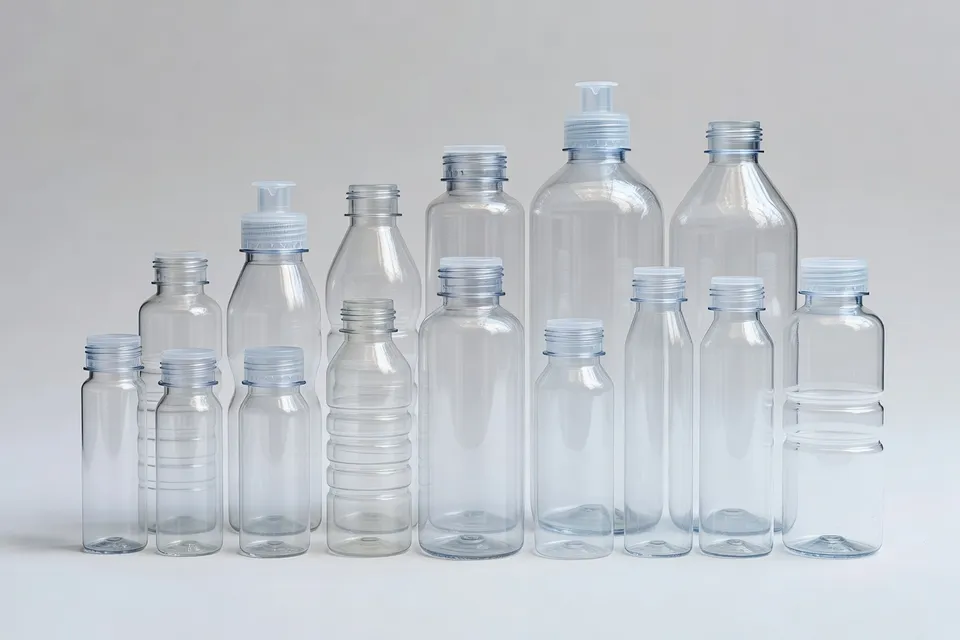
The same source describes rotary blow-molding equipment operating at 2,400 to 2,800 bottles per hour per cavity. It also reports machines using 48 or 72 cavities to exceed 80,000 bottles per hour. Those figures describe equipment capability and operating relationships, not a verified output result across the industry.
A separate 2026 guide places top-tier small-format water lines at 80,000 to 100,000 bottles per hour for 500-milliliter containers. For 1.5-liter bottles, it identifies 40,000 to 50,000 bottles per hour as standard for high-volume lines. The guide associates those rates with rotary blowers of up to 36 cavities and synchronized combi-block systems.
A capacity comparison is useful only when the bottle format and geography remain fixed. The available material does not provide a common plant dataset that ranks all cited machines on one basis.
| Equipment or operating measure | Reported figure | Limitation in the evidence |
|---|---|---|
| Rotary blow-molding productivity | 2,400–2,800 BPH per cavity | Equipment guidance, not a common plant trial |
| Small-format water lines | 80,000–100,000 BPH | Described for 500 ml bottles |
| Larger-format water lines | 40,000–50,000 BPH | Described for 1.5-liter bottles |
| Rotary machine cavity examples | Up to 36 cavities; 48 or 72 cavities elsewhere | Different source descriptions and operating contexts |
The preform-cavity guidance also reports that moving from linear eight-cavity systems to rotary systems with 24 or more cavities can reduce energy consumption per bottle by 12%. It gives a potential unit-cost reduction of up to 18% from cavity and cycle optimization. Those percentages are presented as guidance claims; the supplied material does not provide the underlying plant, period, or control sample needed to treat them as a sector-wide result.
Mexico case shifts the constraint from output to uniformity
BANGE Machine (a PET equipment supplier presenting a 6-cavity full-servo blow-molding installation) describes a 2025 upgrade for a bottled-water producer in Mexico. The customer supplied 350-milliliter, 500-milliliter, 1-liter, and 1.5-liter PET bottles through supermarkets, convenience stores, and wholesale distributors.
The case identifies cavity-to-cavity quality variation as an operating problem. The producer sought more capacity for seasonal backlogs, lower energy use per bottle, improved wall-thickness consistency, and lightweighting without drop-test failure. BANGE says its assessment found cooling imbalance inside the mold: some cavities cooled faster than others, increasing the risk of uneven crystallization, deformation, and inconsistent wall thickness.
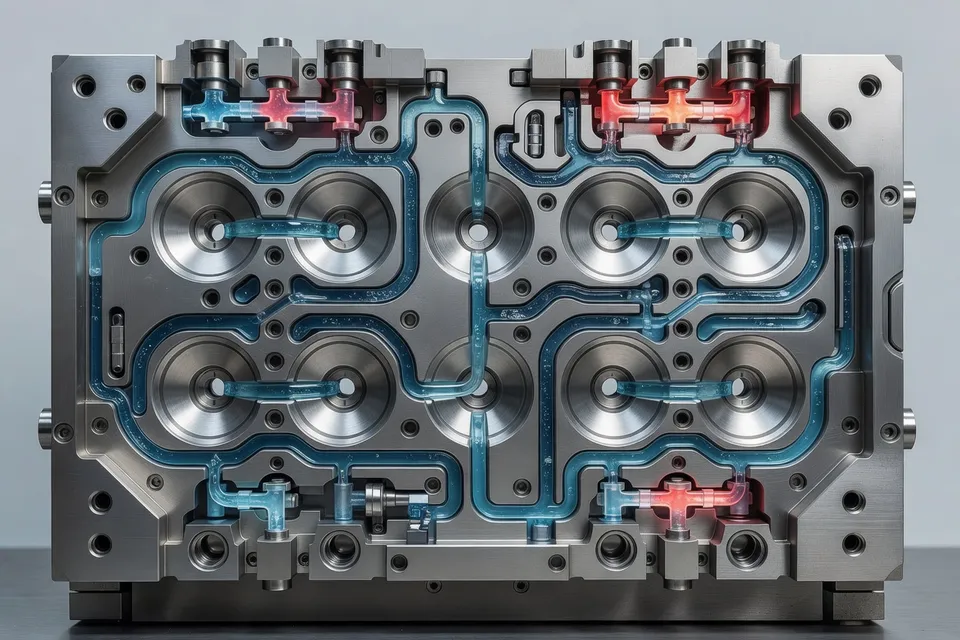
The supplier’s response was not simply a higher cavity count. It combined six cavities with full-servo motion control, infrared heating, air-management loops, and rebalanced internal cooling circuits. That distinction matters for converters and bottlers assessing a capacity purchase. A machine can add theoretical cycles while leaving the plant with rejects, manual adjustments, or a bottle that fails downstream handling tests.
After installation and commissioning, the case reports continuous automated operation, more uniform wall-thickness distribution, improved air recovery, and a reject rate of no more than 0.15%. It also reports a cost reduction of more than 25% and successful lightweighting without performance loss. These are supplier-reported results from one Mexican customer; they are not a controlled comparison with every cavity configuration or a regional average.
The case therefore supports a narrower conclusion: controls and cooling can determine whether nominal cavity capacity becomes usable production. It does not prove that six cavities outperform a larger rotary system. The object measured was a specific installed line serving several bottle sizes in Mexico.
Air management carries a separate energy limit
The 2026 blow-molding guidance assigns 60% to 70% of total bottling-line energy consumption to the blowing process. It describes high-pressure exhaust air at up to 40 bar being recovered for lower-pressure uses at about 7 bar, including pre-blowing and machine actuation. The cited mechanism can reduce compressor load by up to 35% and total compressed-air energy costs by 30% to 40%.
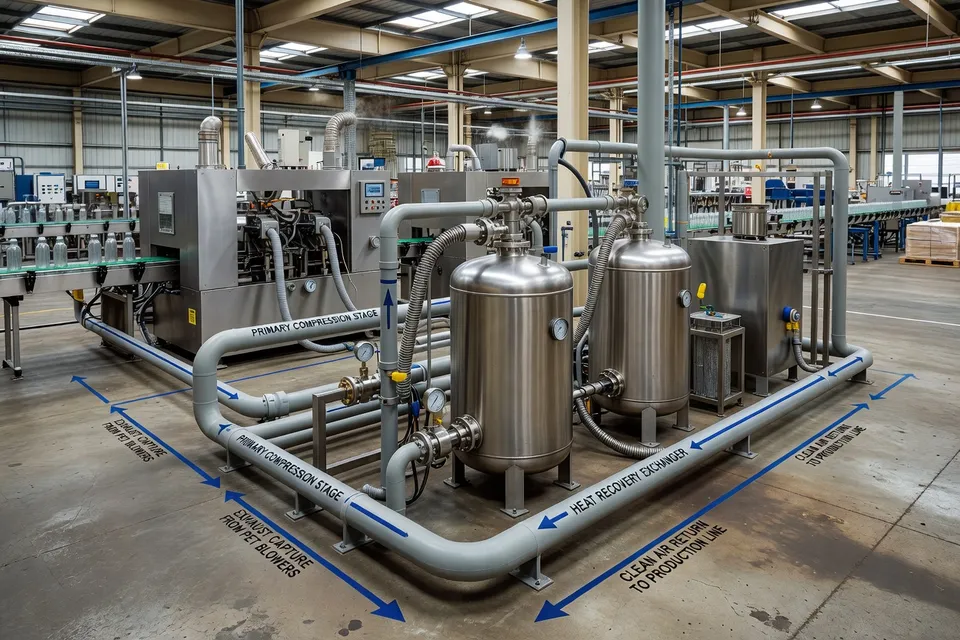
The same source gives a typical energy range of 0.30 to 0.45 kilowatt-hours per kilogram of processed material for state-of-the-art PET blow-molding machines in 2026. It reports as low as 0.28 kilowatt-hours per kilogram for models with air recovery, NIR heating, and servo-electric drives, and characterizes that as a 25% to 30% improvement over machines from the previous decade.
These values use different denominators. The first is expressed per kilogram of processed PET; the other claims concern compressor load, compressed-air cost, or total line energy. They should not be combined into one savings calculation without a plant-level energy boundary.
For a processor, the purchasing question is consequently divided. Cavity count addresses potential throughput. Cooling circuits address dimensional consistency. Servo controls address motion repeatability. Air recovery addresses the energy attached to high-pressure blowing. A supplier claim in one category cannot substitute for verification in the others.
Fakuma coverage places controls beside productivity
Fakuma 2026 coverage from the supplied sources describes productivity, precision, artificial-intelligence functions, and high-volume production as linked equipment themes. The material does not supply a common numeric trial result across the exhibitors discussed, so it cannot establish a ranking of machinery builders.
The relevance to PET packaging lines is the direction of the equipment offer. High-volume systems are being presented with more integrated sensing and control rather than with cavity count as an isolated specification. That is consistent with the Mexican case, where the reported intervention addressed cooling balance, heating, servo movement, and air use together.
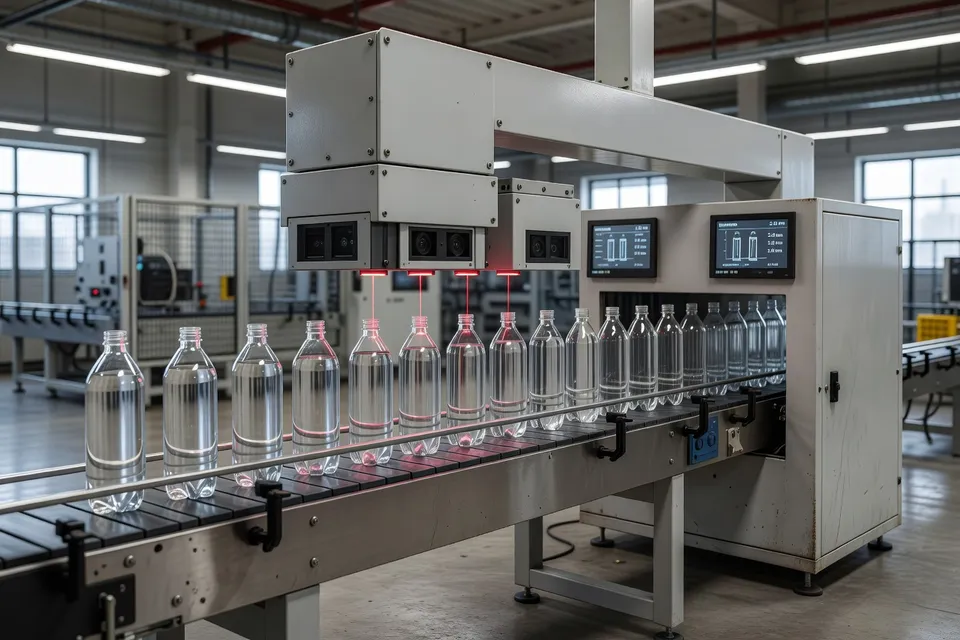
The distinction between a demonstrated installation and an exhibition or editorial claim remains material. The Mexico project includes a customer application, bottle formats, a commissioning result, and reported reject and cost figures. The Fakuma material establishes product and technology emphasis, but the supplied information does not provide equivalent plant data for each machine.
Buyers comparing proposals should hold the evidence to the same unit: bottle format, cavities, cycles per hour, accepted output, reject rate, energy denominator, and trial period. A headline BPH value is incomplete if it omits whether the line produced 500-milliliter or 1.5-liter bottles, whether output was gross or accepted, and whether manual intervention was required.
The next checkable points are commissioning records for the installed lines, trial-lot quality data for lightweight preforms, and the contract or production month used to validate the cited 2026 capacity and energy claims.
Editorial Insights
- How should a bottler compare cavity counts when the bottle portfolio includes both 500-milliliter and 1.5-liter formats?
- Ask for accepted bottles per hour by format, not the machine’s maximum cavity number. Higher cavity counts can raise theoretical output, but tighter pitch may restrict bottle diameter, so a configuration suited to 500-milliliter containers may not suit a 1.5-liter bottle. Verify cavities, cycles per hour, gross and accepted output, changeover conditions, and the bottle’s wall-thickness and drop-test results in the same trial. The usual mistake is comparing a high-cavity small-format figure with a lower-cavity large-format line as though they were equivalent.
- What evidence is needed before treating servo controls and balanced cooling as a capacity improvement?
- Refuse to count nominal cycles as usable capacity until the line produces stable bottles across all cavities. Request commissioning records showing cavity-to-cavity wall-thickness distribution, cooling-water balance, reject rate, dimensional checks, and downstream handling performance over a sustained run. Servo motion, infrared heating, and rebalanced cooling can make more of the rated output saleable, but they do not remove the need for mold compatibility and process validation. A common failure mode is adding speed while one cavity still cools or stretches differently, shifting the problem from the machine display to rejects and manual intervention.
- How should compressed-air savings be verified on a PET blow-molding line?
- Measure the compressor load, recovered-air flow, pressure levels, and total line energy before and after the change, using the same production format and plant boundary. Air recovery may reduce high-pressure compressor demand by redirecting exhaust air to pre-blowing or low-pressure machine functions, but a percentage stated for compressor load is not automatically a percentage of total line-energy savings. The friction is in the denominator: teams often combine kilowatt-hours per kilogram, compressed-air cost, and total-line figures into one attractive claim without recording which loads were included.
- When does a higher-cavity machine fail to improve the filling operation’s real capacity?
- Check the accepted output against the filler’s actual demand, not just the blow molder’s rated BPH. Conveyors, filling, labeling, air supply, cooling, preform handling, and maintenance windows must support the selected cycle rate. If any of those systems lag, the extra cavities create accumulation, stoppages, or inventory rather than sellable throughput. The usual way this goes wrong is that the blow-molding section reaches its headline speed while downstream equipment or utilities force the line back to the old rate.
- What should be written into an equipment trial or purchase specification to make capacity claims auditable?
- Specify the bottle format, preform and bottle weight, cavity count, cycles per hour, accepted BPH, reject definition, energy denominator, compressed-air conditions, trial duration, and permitted manual adjustments. Require cavity-level quality data and records for wall thickness, dimensions, drop performance, and cooling and air-system readings. Exhibition claims and supplier guidance can identify useful features, but they are not equivalent to a customer installation with production records. Without a common test basis, a quoted 80,000 BPH figure can conceal a different bottle size, gross rather than accepted output, or a short demonstration run.
References
- 1.iBottling. (2026, October 6). Water bottling preform cavities BPH 2026 ultimate guide. iBottling.
- 2.iBottling. (2026, October 3). PET blow molding water bottling 2026 ultimate guide. iBottling.
- 3.BANGE Machine. (2026, October 6). How a 6-cavity high-speed PET blow molding machine helped a Mexican bottled water producer increase capacity and accelerate sustainable growth. BANGE Machine.
- 4.BANGE Machine. News. BANGE Machine.
- 5.Delta Engineering. Case studies and insights. Delta Engineering.
- 6.Fakuma. News stories. Fakuma.
- 7.Eco Plastics in Packaging. Fakuma 2026: Productivity, precision and smarter plastics processing. Eco Plastics in Packaging.
- 8.PlasticPortal.eu. Engel at Fakuma 2026: AI, precision and high-volume production live. PlasticPortal.eu.