


Dow is treating the North American polyethylene market as a supply-led pricing story rather than a demand recovery. During its October 22 third-quarter earnings call, the producer pointed to declining inventories, constrained U.S. production and higher feedstock costs behind a cumulative 12 cents per pound in nominated October and November PE increases. September contracts had already risen 5 cents per pound.
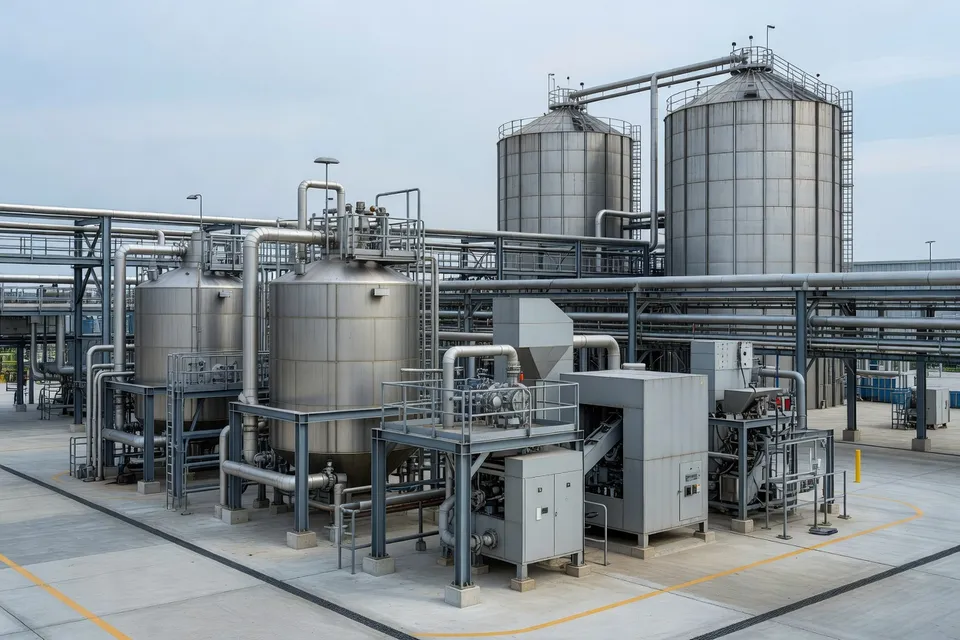
That position has a measurable operating limit. U.S. plastics material and resin capacity utilization fell to 81.7204% in the third quarter of 2026 from 85.1231% in the second quarter, according to the Federal Reserve series for NAICS 325211. The rate remained below the 83.6824% recorded in the third quarter of 2025. A lower utilization rate does not prove that every PE grade was short, but it does weaken any simple claim that the market's price direction reflects full-system operating intensity.
U.S. plastics material and resin capacity utilization, 2025-2026
| Quarter | Capacity utilization (%) |
|---|---|
| Q3 2025 | 83.6824 % |
| Q2 2026 | 85.1231 % |
| Q3 2026 | 81.7204 % |
The tighter explanation is selective availability. Dow executives cited constrained production linked to the U.S. war in Iran, while also pointing to elevated crude and naphtha costs and rising U.S. ethane prices. The company said each additional 3 cents per gallon of ethane costs approximately 1 cent per pound of PE to cover. Its fourth-quarter guidance assumed ethane in the mid-to-high 20 cents-per-gallon range, marginally below the level prevailing during the call.
The contract increase
The available price evidence separates a recorded move from a proposed one. September PE contracts increased by 5 cents per pound. Dow's October and November nominations added 12 cents per pound cumulatively. Spot PE prices had risen 6 cents per pound during the week before the earnings call. These are not interchangeable measures: one is a settled contract movement, one is a producer nomination, and one is a spot indication.
| Measure | Value | Period |
|---|---|---|
| PE contract increase | 5 cents/lb | September 2026 |
| Dow nominated increase | 12 cents/lb cumulative | October-November 2026 |
| PE spot price increase | 6 cents/lb | Week before October 22, 2026 |
The table shows why the market should not be described as having already absorbed the full November increase. The contract record supports a September move; the October-November figure remains a nominated increase whose acceptance must be tested in transactions.

Dow's argument extends beyond North America. Chief executive Karen Carter said global PE prices are influenced by naphtha-based production, making crude and naphtha important to the margin structure even where North American crackers use ethane. That mechanism supports a higher cost floor, but it does not establish how much of the nominated increase converters will accept. Buyers still have to distinguish feedstock pass-through from a genuine reduction in available resin.
Utilization below the prior-year quarter
The Federal Reserve's quarterly capacity measure supplies the clearest restraint on the bullish case. Plastics material and resin utilization reached 81.7204% in the third quarter, down 3.4027 percentage points from the second quarter and 1.962% below the same quarter of 2025. The series measures output against sustainable maximum capacity for the industry classified under NAICS 325211; it is not a PE-only operating rate.

That distinction matters for procurement. A broad resin utilization figure can show that the U.S. sector was not running at a uniformly elevated rate, while a specific PE chain still experiences tighter supply because of outages, inventories, grade mix, logistics or feedstock constraints. It cannot, by itself, rank individual PE producers or establish that North American PE capacity was physically unavailable across all grades.
The American Chemistry Council's August statistics point in the same direction of uneven evidence. U.S. production of major plastic resins totaled 9.1 billion pounds in August 2026, up 1.7% from July but down 0.7% from August 2025. Year-to-date production reached 71.3 billion pounds, 4.3% above the comparable 2025 period. Sales and captive use also totaled 9.1 billion pounds in August, up 3.8% year on year, while year-to-date sales and captive use rose 2.2% to 69.8 billion pounds.
Those figures cover major plastic resins rather than PE alone. They show a market in which cumulative output and use were higher, but August production lagged the prior year while sales and captive use increased. That combination is consistent with tighter availability in selected chains, not proof of a universal PE shortage.
The capacity addition
The next major supply variable is Golden Triangle, the Chevron Phillips Chemical and QatarEnergy joint venture in Texas. Dow said the new ethylene and PE complex planned to start production in early 2027. The project could increase regional supply, but its immediate effect is not available in the 2026 utilization figures and its capacity is not specified in the information reviewed here.
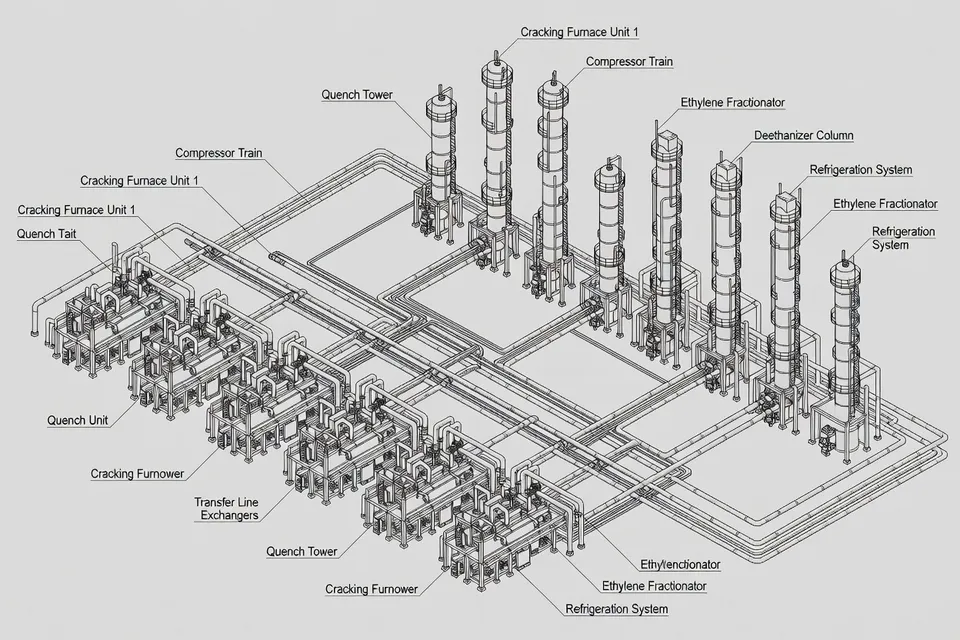
Its feedstock effect may arrive before its resin effect. Dow expects the complex to increase demand for ethane, while exports are already contributing to higher U.S. ethane prices. That creates a less comfortable supply narrative: a new PE plant can add polymer capacity and still tighten the feedstock balance used by crackers. The project therefore changes the 2027 assumption, but it does not erase the 2026 question of how much nominated price increase converters will accept.
For processors, the practical test is not whether Dow's outlook sounds bullish. It is whether contract settlements follow the nominations while inventories remain low and production constraints persist. The current evidence supports a firm near-term negotiating position for producers, but the Federal Reserve utilization rate prevents a clean conclusion that the entire North American resin system is operating at maximum intensity.
The next hard check is the Federal Reserve's scheduled November 17 release of the third-quarter capacity-utilization series update. The more consequential operational marker is Golden Triangle's planned early-2027 start-up. Until those points arrive, North American PE tightness is best treated as a constrained, grade- and event-sensitive pricing condition—not as a completed industry-wide utilization story.
Editorial Insights
- How should a converter separate a settled PE increase from a producer nomination?
- Refuse to book the nominated increase as a market fact. File the settled contract movement, the producer’s nomination, and the spot indication as three separate records, then compare them with the actual grade, volume, delivery point, and transaction date. The usual mistake is letting a spot quote or announced surcharge become the assumed contract baseline before customers have accepted it.
- When should a rubber lot be quarantined instead of being adjusted at the press?
- Quarantine the lot when its cure curve moves outside the approved range, the baseline is missing, or QA has placed it on hold. Compare minimum cure behavior, maximum torque, and cure rate with the established lot baseline before touching pressure or cure time. A press setting that improves one cavity does not prove the compound is acceptable; it can simply mask polymer or curative variation and add another uncontrolled variable.
- How can the defect location distinguish an air trap from a flash problem?
- Mark the rejected part and compare the defect with the nearest vent, feed path, cavity, and parting-line segment. A void that repeats at one cavity position sends the inspection toward restricted venting or uneven flow; flash concentrated in one area points first to a damaged, contaminated, or misaligned tool interface. Broad flash requires a wider check of closure, charge, and process conditions. Do not treat both defects as a reason to raise pressure.
- What should be checked before increasing pressure to correct a repeated short shot?
- Check shot size, preform or feed uniformity, the restricted flow path, mold temperature, injection speed, and the cavity location of the missing rubber. A short shot means the cavity did not fill; more cure time will not repair it. If cleaning does not restore the same feature, stop increasing pressure because a blocked gate, vent, or cavity restriction may remain, while the added force creates flash elsewhere.
- How should ethane and naphtha costs be tested against a proposed PE increase?
- Request the feedstock assumption, conversion basis, and effective period behind the proposal, then compare that cost movement with the resin line being purchased. Higher ethane or naphtha can support a higher cost floor, but it does not establish that every PE grade has become less available. The friction is that a feedstock calculation can be directionally correct while still overstating what the transaction supports when inventories, imports, or grade mix have not tightened.
- What should procurement verify before relying on a future capacity addition to moderate PE pricing?
- Do not count planned polymer capacity as current supply. Verify the start-up sequence, feedstock availability, qualification timing, grade slate, ramp reliability, and commercial shipment date before changing coverage assumptions. A new complex may add PE while increasing ethane demand, so the feedstock balance can tighten before the resin balance improves. Treat the project as a 2027 scenario input, not as relief for a 2026 contract negotiation.
- How should mold-release practice be controlled when parts stick, tear, or show dull areas?
- Clean and inspect the cavity first, then apply a thin, even release film with a defined flash-off time and a documented application method. Compare operators on the same mold and compound; if release quality changes by operator, the film process is not controlled. More release over accumulated residue is not a fix and can create blemishes, transfer, or adhesion problems.
- How can a buyer decide whether to add PE inventory while supply evidence remains selective?
- Set coverage by grade and confirmed consumption, not by a headline shortage claim. Check current on-hand material, open orders, supplier allocation, substitution approval, shelf-life exposure where applicable, and the cost of carrying extra resin against the risk of a missed run. The failure mode is building broad inventory because one grade is tight, then discovering that the added stock does not cover the constrained specification or outlasts the price event.
- What evidence is required before a corrected molding process returns to production?
- Repeat the test that identified the failure and verify the correction across consecutive parts. Recheck cure or rheology for a compound shift, confirm filling and release after a vent or parting-line repair, and verify hardness or the applicable finished-part requirement for cure concerns. File the defect map, mold condition record, material lot, and current cure data. If the same test does not show recovery, keep the lot or mold on hold and trace upstream rather than declaring the visual defect closed.
References
- 1.Antoinette Smith. (2026, October 29). Dow bullish on PE pricing into 2027. Resource Recycling.
- 1.Alpha Technologies. (2026, October 27). Rubber manufacturing troubleshooting: A complete guide for process engineers. Alpha Technologies.
- 2.Joseph Chang. (2026, October 28). Dow CEO sees upside to Q4 guidance on Oct and Nov PE price hikes. ICIS.
- 2.Sector Newsdesk. (2026, October 30). When does rubber injection molding equipment need a vacuum system? Sector Newsdesk.
- 3.Jennifer Killinger. (2026, October 27). ACC releases August 2026 resin production and sales statistics. American Chemistry Council.
- 3.MDPI. Rubber polymers. MDPI.
- 4.PRWeb. Resinsmart says buyers must look beyond October resin price increases. PRWeb.
- 4.Netray. PPAP and IATF 16949 for rubber parts suppliers. Netray.
- 5.Plastics Technology. October 2026: A mostly flat to down price trajectory for volume resins. Plastics Technology.
- 5.Stoner Molding. Rubber molding defects: Causes, prevention, and solutions. Stoner Molding.
- 6.Plastics Technology. November 2026: Flat to down price trajectory for the five commodity resins. Plastics Technology.
- 6.Fuste Rubber. Automotive rubber parts failure analysis: Common problems and how manufacturers prevent them. Fuste Rubber.
- 7.Federal Reserve Bank of St. Louis. Capacity utilization: Plastics material and resin manufacturing. Federal Reserve Bank of St. Louis.
- 7.Hwayi Rubber Machine. Rubber injection molding problems and solutions. Hwayi Rubber Machine.
- 8.Board of Governors of the Federal Reserve System. Industrial production and capacity utilization: Supplemental tables. Board of Governors of the Federal Reserve System.
- 8.Imateg. Rubber defects. Imateg.
- 9.PlasticsToday. U.S. plastics sectors forecast 2026 growth. PlasticsToday.
